Sign up for The Media Today, CJR’s daily newsletter.
When Frank Matt finally received the Department of Labor database after an eight-month FOIA battle, it was a mess: 70 million records in a few gigantic spreadsheets. Matt was the data journalist on McClatchy DC’s “Irradiated,” a year-long investigation into the unseen costs of America’s nuclear weapons program, and when he got the spreadsheets, his work was just beginning.
The database contained claims submitted to a government program, launched in 2001, to compensate former nuclear employees suffering from illnesses related to their work. For the government, it was a database of cases to be adjudicated, and was documented accordingly. But for Matt and the other McClatchy journalists, the spreadsheets held the lives and fates of tens of thousands of cold war workers. They just had to decode it.
“Our goal,” says Matt, “was to humanize an anonymous dataset.” The data came with unique identifiers for every worker instead of names, to protect their privacy, and because any given worker might have multiple claims.
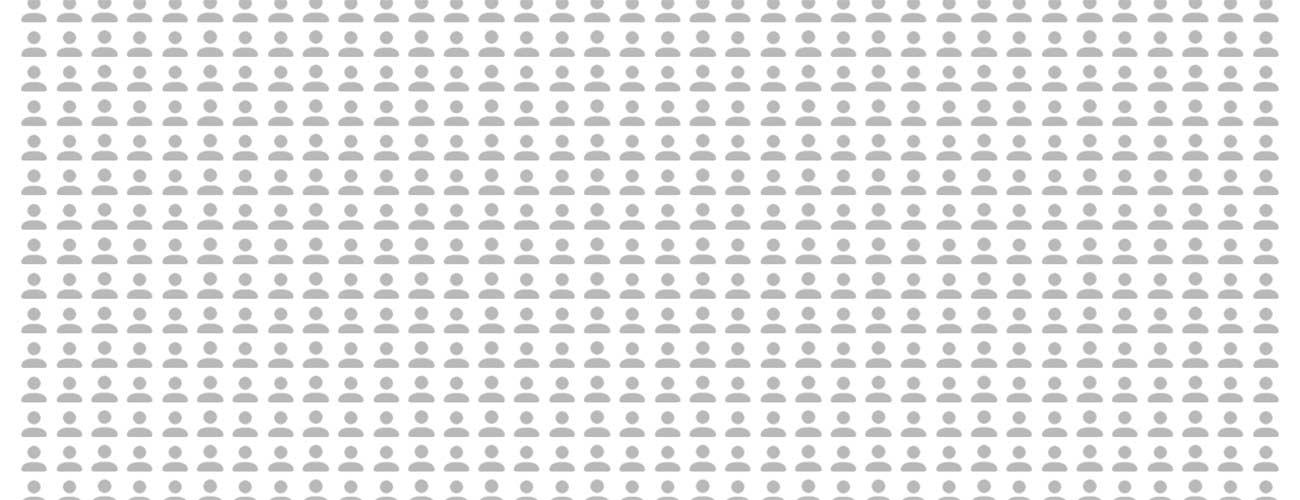
The final project combined the data with deep on-the-ground reporting and an ambitious presentation that used a homebrewed algorithm to transform the massive database into 107,392 micro-stories. McClatchy published them all in one ever-scrolling Web page, which appears first as a grid of gray icons–a round head atop half-moon shoulders–representing each worker. Clicking on an icon reveals the story underneath.
But for all its meticulous focus on breathing life into numbers, the story also demonstrated the limitations of relying on numbers to tell a story–or at least the extra care that must be taken to make sure that they are contextualized.
The series subhed refers to “33,480 Americans dead,” conveying the impression that more than 33,000 workers died because of their nuclear work. In fact, the number refers to the 33,480 Americans who were compensated under the program and are now dead. The government has acknowledged that some 15,000 of those deaths were caused by a work-related illness. The rest only had illnesses linked to their nuclear work, and may have died of old age or other unrelated causes.
Jim Asher, McClatchy’s Washington bureau chief and the project’s editor, defended the use of the larger number. “We wanted to point out that this was not a cost-free industry,” he says, and to “raise the possibility that people aren’t paying enough attention to the future risks.”
While computer-generated copy has been used to produce highly formulaic sports and business stories based on data, “Irradiated” takes a novel approach, combining journalism and computer-science to turn human lives that had been reduced to numbers back into stories.
Readers can click a tab to show or hide the grid, which then fades to the background behind a four-part narrative about the lives of several current and former workers, including two sisters recruited in 1944 to produce the uranium for the atomic bombs used on Hiroshima and Nagasaki, and a nuclear facility operator in Idaho who was exposed to radioactive plutonium oxide in 2011. Some characters in the stories are linked to numbered icons in the chart, connecting the data and the narratives.
The presentation provides readers with a visceral feel for the scope of the damage wrought on America’s nuclear workforce, while simultaneously conveying the lives and fates of individual people. Through the micro-stories, no more than several lines each, readers learn a few key details about the workers’ jobs, their radiation-related medical complaints, and the status of their claims.
Employee #50801 died on January 2, 2010. Worked at Huntington Pilot Plant as a quality control inspector and received $6,520.55 in medical payments after suffering from skin malignant melanoma, chronic obstructive pulmonary diseases, brain cancer and skin cancer.
Employee #50808 is still alive. Worked at Hanford as a pipefitter and received $450.00 in medical payments after suffering from skin malignant melanoma, family history monitoring, Asbestosis, carcinoma in situ and skin cancer.
Matt and Danny Dougherty, the developer on the team, tweaked the algorithm over and over to get the language right. They needed to account for variations in the data, like whether the claimants were workers or family members; for the fact that a death might be reported in one of five different columns; that the dataset didn’t include gender; and for the many other quirks of a database not designed for storytelling.
After several iterations, and with publication approaching, Matt still felt something was missing. The dataset contained at least two fields for job descriptions: one with generic labels like “management” or “labor,” and the other with job descriptions the workers wrote themselves during the claims process. The algorithm had been using the first set, which was bland but uniform; Matt decided to use the second set, where the language was messy and colorful, and included misspellings. If the goal was to humanize the data, says Matt, “what better way to do it than to use their own words?”
That’s how Matt found himself cleaning thousands of job descriptions of the people who built America’s nuclear arsenal: mechanics, welders, pipefitters, programmers, reactor specialists, and one employee who helped build the Phoebus 2-A, a nuclear propulsion rocket that NASA hoped might one day take a man to Mars.
Producing a data project of this size was a first for McClatchy. When Asher realized that the story would require a substantial time commitment beyond Matt’s regular reporting contract, he and Matt applied for a grant from the Nation Institute’s Investigative Fund so that Matt could keep working on it.
Since the story was published, several people have asked Matt to help them identify the data point belonging to a grandparent or other loved one. “I’ve been able to provide them with that,” says Matt, “which has been pretty cool.”
Has America ever needed a media defender more than now? Help us by joining CJR today.


