Ahead of the November 6 elections, CJR invited writers to spotlight stories that deserve closer scrutiny, in their states and beyond, before voters cast their ballots. Read dispatches from “States of the Union” here.
For those of us with memories of November 8, 2016, etched into our temporal lobes, one crack of the neck in the wrong direction brings a singular image back into focus: The New York Times election needle, fluttering with a constantly updating probability of the presidential result like a feather in the breeze. The Times’s pre-election model, devised from campaign polls and other data, had given Clinton an 85-percent chance of winning. But as vote counts began trickling in, the live forecast’s needle trembled toward a likely Trump presidency. Social media users, shocked by the possibility, quickly painted the jittery Times visualization as a catchall symbol for the wayward predictions that had seemed to assure a comfortable Clinton victory.
Screenshot via The New York Times
Election handicapping has long been a fixture of campaign coverage, with niche outlets like The Cook Political Report and the University of Virginia–affiliated Sabato’s Crystal Ball publishing qualitative projections. The data-driven models that lend such analyses an air of laser-like precision are relatively nascent, and 2016 shocked them to the core. Media outlets put Trump’s chances of victory anywhere from HuffPost’s laughable 1.7 percent to FiveThirtyEight’s plausible 28.6 percent. Making matters worse for the data nerds, pundits and campaign reporters often simplified the scientific-sounding numbers to bolster their traditional horse-race framing of who was up and who was down.
ICYMI: Do journalists pay too much attention to Twitter?
If the public surprise to Trump’s win was any indication, even the few warnings of uncertainty by these experts went unheeded. The needle’s meme-ification was among the early shots in a circular firing squad of finger-pointing and recriminations that has lasted the better part of two years. As news organizations rev up their coverage for midterm elections, the credibility of polling analysis is back on the line. And the question of how to predict what might happen looms ever larger given the political stakes, leaving prognosticators to reconsider how they frame predictions for laypeople—if they produce them at all.
“We’re not boiling the polls down to a single number this year, in part because I feel like I still don’t know how to do it,” Amanda Cox, editor of the Times’ data section, The Upshot, said last week at the Brown Institute for Media Innovation at Columbia Journalism School.
Across this small but growing cohort of campaign analysis, the marching orders are to avoid any appearance of the sort of certainty given off two years ago.
HuffPost’s election forecast is likewise nowhere to be found. And the Princeton Election Consortium, whose publisher ate a cricket on live TV after giving Clinton a 99-percent chance of winning, has also retreated from probabilities. As Cox explained, it’s hard to communicate them “in a way where everybody gets it.”
The Times’ much-criticized needle, however, will be back with a vengeance in the hope of contextualizing results from far-off districts within the broader congressional map. In an addition to its coverage that’s striking in scope, the news organization has partnered with Siena College to conduct dozens of live polls of House and Senate races, allowing audiences to peer under the hood as a call bank of college students tries—and mostly fails—to reach poll respondents in real time.
“Lots of people left 2016 feeling hurt about polling, or confused about what it is and what went wrong, and why it could be wrong,” Cox said. “So, part of our strategy this year is to help people understand more what it is.”
Across this small but growing cohort of campaign analysis, the marching orders are to avoid any appearance of the sort of certainty given off two years ago. “We try to be cautious, and we’re particularly trying to be cautious this time,” said Kyle Kondik, managing editor of Sabato’s Crystal Ball. The qualitative handicapping outfit offered a mea culpa after projecting a decisive Clinton victory in 2016. This time around, it’s partnered with the polling firm Ipsos to publish an interactive map intended to make its somewhat foggier crystal ball more accessible.
For those who boil forecasts down to an exact number, the unknown variable is the extent to which such probabilities are open to wildly different interpretations. A working paper released by researchers at Dartmouth College, the University of Pennsylvania, and the Pew Research Center earlier this year suggests that probabilistic forecasts may confuse normal news consumers and could even dampen turnout if voters see their candidate as likely to win.
A decent chunk of respondents to the study confused the probability of a candidate winning with his or her projected vote share. What’s more, researchers found that those surveyed often understood probabilities subjectively, hardening their perceptions that whoever is “ahead” in a forecast will win. It seems possible that such dynamics played out among liberals—not to mention many journalists and pundits—clinging to rose-colored projections of an easy Clinton win.
“People have had 50 years to think through and understand what it means when a candidate is five points up or five points down in the polls,” said Solomon Messing, a co-author of the study and former director of Data Labs at the Pew Research Center. “They don’t have that history with, Clinton has a 75-percent chance to win the election.”
The whizzes at FiveThirtyEight, which handicapped the general election more cautiously than others after whiffing alongside everyone else on Trump’s primary chances, pooh-poohed the findings. But in launching three versions of its forecasts this cycle—“Lite,” “Classic,” and “Deluxe,” each signified by increasingly decadent burger emojis—the site also tweaked the way it conveys probabilities. Rather than lead with Democrats’ 84.7-percent chance of retaking the House as of Wednesday morning, the model suggests Democrats have a 6-in-7 shot; Republicans have a 4-in-5 chance of maintaining control of the Senate, as opposed to a 80.5-percent probability.
“Look, for better or for worse, it is easier to explain the uncertainty when you say, ‘There’s a 1-in-4 chance,’ or, ‘a 3-in-10 chance,” FiveThirtyEight Editor in Chief Nate Silver said on an Aug. 30 episode of the outlet’s podcast. He shared a more blanket plea for those following at home during a podcast episode two weeks earlier: “We hope that people are not going to be idiots.” (Silver did not return requests for an interview from this idiot.)
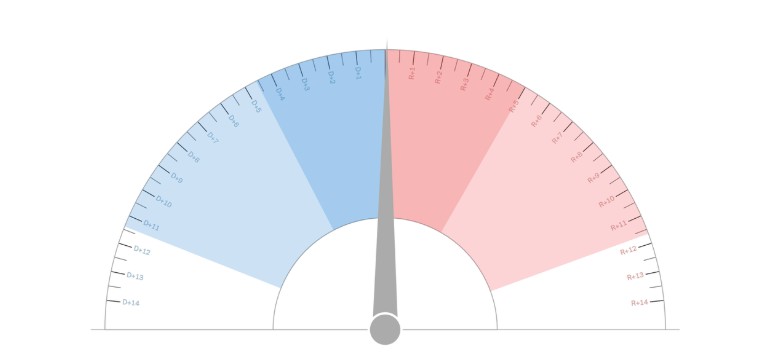
Harry Enten, the former FiveThirtyEight wunderkind who joined CNN this cycle, went a step further in his own model. “The most important [difference from other forecasts] is that we don’t have a probability,” Enten told me. “We have a margin of error…something that’s more familiar with the broader audience.” The resulting projection feels a bit more digestible, even if it stems from the same brand of number-crunching:
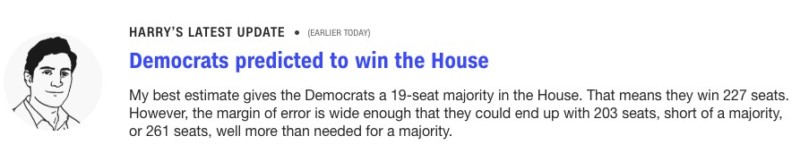
Screenshot via CNN
“The most important thing I learned in 2016 is that you shouldn’t be overconfident,” Enten said. “You should be humble… I would rather there be underconfidence than overconfidence.”
Will such subtle brake-tapping be noticed by pundits and analysts who prefer black-and-white declarations? When Enten appeared on CNN’s New Day last week to unveil his forecast—which is branded, simply enough, as The Forecast—co-host John Berman described it as a “robot to predict the future.” His morning show counterpart, Alisyn Camerota, added: “This sounds very scientific.” While that may be true when comparing such projections to more traditional campaign reporting, it risks imbuing human-made models with infallibility.
University of Minnesota Professor Benjamin Toff described this culture clash as endemic to cash-strapped newsrooms in a 2017 article for the academic publication Journalism. “The tools of social science often reveal more questions than answers, more nuanced ambiguity than clarity – which may be at cross-purposes with the sense-making aims of narrative journalism,” Toff wrote. As the midterms near, this tension will once again take center stage. The question of whether the public can parse it all remains hard to answer with any degree of certainty.
ICYMI: Holding police accountable for their use of deadly force
David Uberti is a writer in New York. He was previously a media reporter for Gizmodo Media Group and a staff writer for CJR. Follow him on Twitter @DavidUberti.